
Settings to optimize taught product if many good products are being rejected.
Start in the main screen.
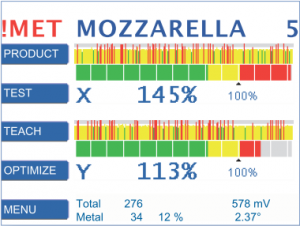
Choose bar graph screen
Press ⯅⯆ until the bar graph screen is shown.
If the the signals look like the example:
Many of the products cause alarms (red lines).
Many of the products are only within the tolerance range (yellow lines).
Press OPTIMIZE if these products are not contaminated.
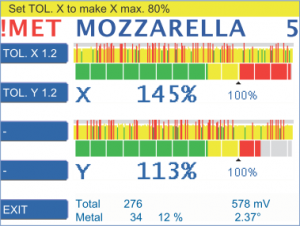
Set tolerances
The yellow notification bar indicates that TOL.X and TOL.Y should be edited. A value between 60 and 80% is the optimum setting for the best sensitivity at the highest stability of detection.
Press TOL.X or TOL.Y.
Press +/- to increase/decrease the value.
Confirm with OK.
In the example the value for TOL.X and TOL.Y is increased from 1.2 to 1.3.
For further information related to tolerance settings refer to:
https://docs.cassel-inspection.com/md/product-x-tol-y-tol
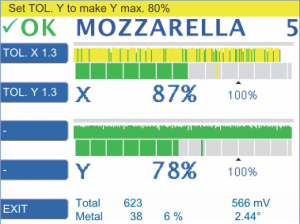
Check and adjust
Due to increasing the tolerance the products are not identified as metal anymore.
The histogram of the X-value shows, that the majority of the signals are still within the tolerance range between 80 and 100%.
Consequently, “irregular products” may cause metal alarms.
Therefore, increase TOL. X , in this example to 1.4.
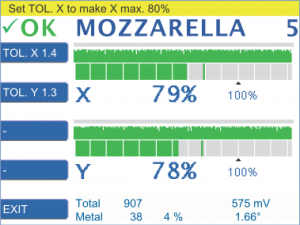
Due to increasing TOL. X all signals are in the range below 80%. All histograms are now green.
Irregular products do not cause metal alarms. They are within the tolerance range.
The metal detector is now set up optimally. Only contaminated products cause metal alarms.
Comments 2
Comments are closed.